Neoinventory
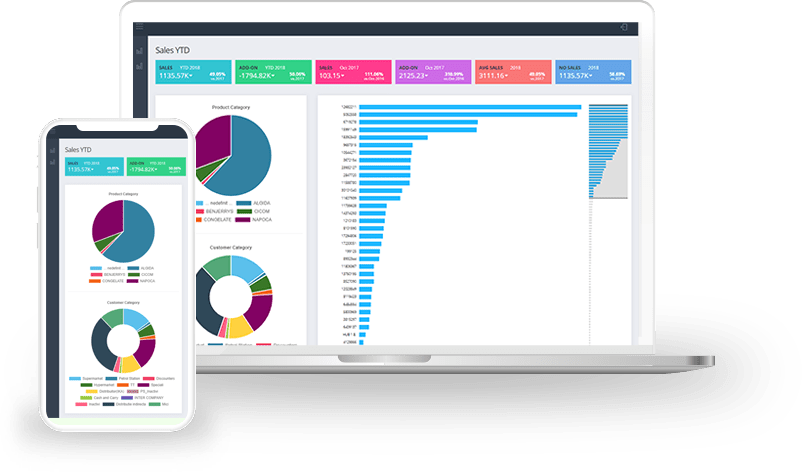
We built data analytics module for Neoinventory ERP. This system includes many live data synchronization in form of different chart like bar, pie, line etc. The system had millions of records and based on the data filtration we had to render a data into graphical forms we used chart js and d3 chart library to bind charts based on data.
Eager to Use our Service?
Let’s discuss your ideas and see what our team can do for you.

Challenges
- Due to millions of records application taking too much time to render chart we optimized SQLQueries by implementing and creating indexes in SQL server we used SQL procedure to get data from different table based on filtered criteria.
- Implementing D3 Chart library.
- Design compact UI/UX to show any length of a chart.
- Provide real-time filtering.
TECHNOLOGIES WE USED
- ASP.NET MVC 4.2
- HTML 5
- CSS 3
- BOOTSTRAP 3
- ANGULAR 5
- SQL SERVER
Our Approach
- We have provided different invoice report like Invoice Day, Invoice Month, Invoice Year.
- Provided a different filter to calculate the data.
- Provided elaborate transaction detail with gross price, net price, and different add-on.
- Provided different sales reports like agent sales, client sales, and district/region sales.
Our Solution
Provide a bar chart to show comparisons between categories of data.
Provide Pie chart to show percentage or proportional data.

 Blazor
 Angular
 ASP.NET Core
 NodeJS
 React Native


 60+
60+